It's possible to calculate a number of interdependence indicators on the basis of voting results, published on the site of the Central Election Commission. We used the Pearson correlation coefficient and correlation diagrams to show citizen moods in voting process. As a result, we received illustrative and simple correlation scheme. We can see on this scheme parties which were stealing each other's electorate and created excessive competition. Having included to voter turnout into the calculation, we saw which parties were given odds as a result of the low voter turnout.
We took the results of voting by party lists at 29652 polling stations as a source data. The data from single-member district #59 wasn't complete, as long as results from 89 of 111 (80.18%) polling stations were published at the moment of receiving the data. To calculate the correlation coefficient and make the correlation diagram, we used the programming language R.
The color and size of squares show direction and strength of correlation.
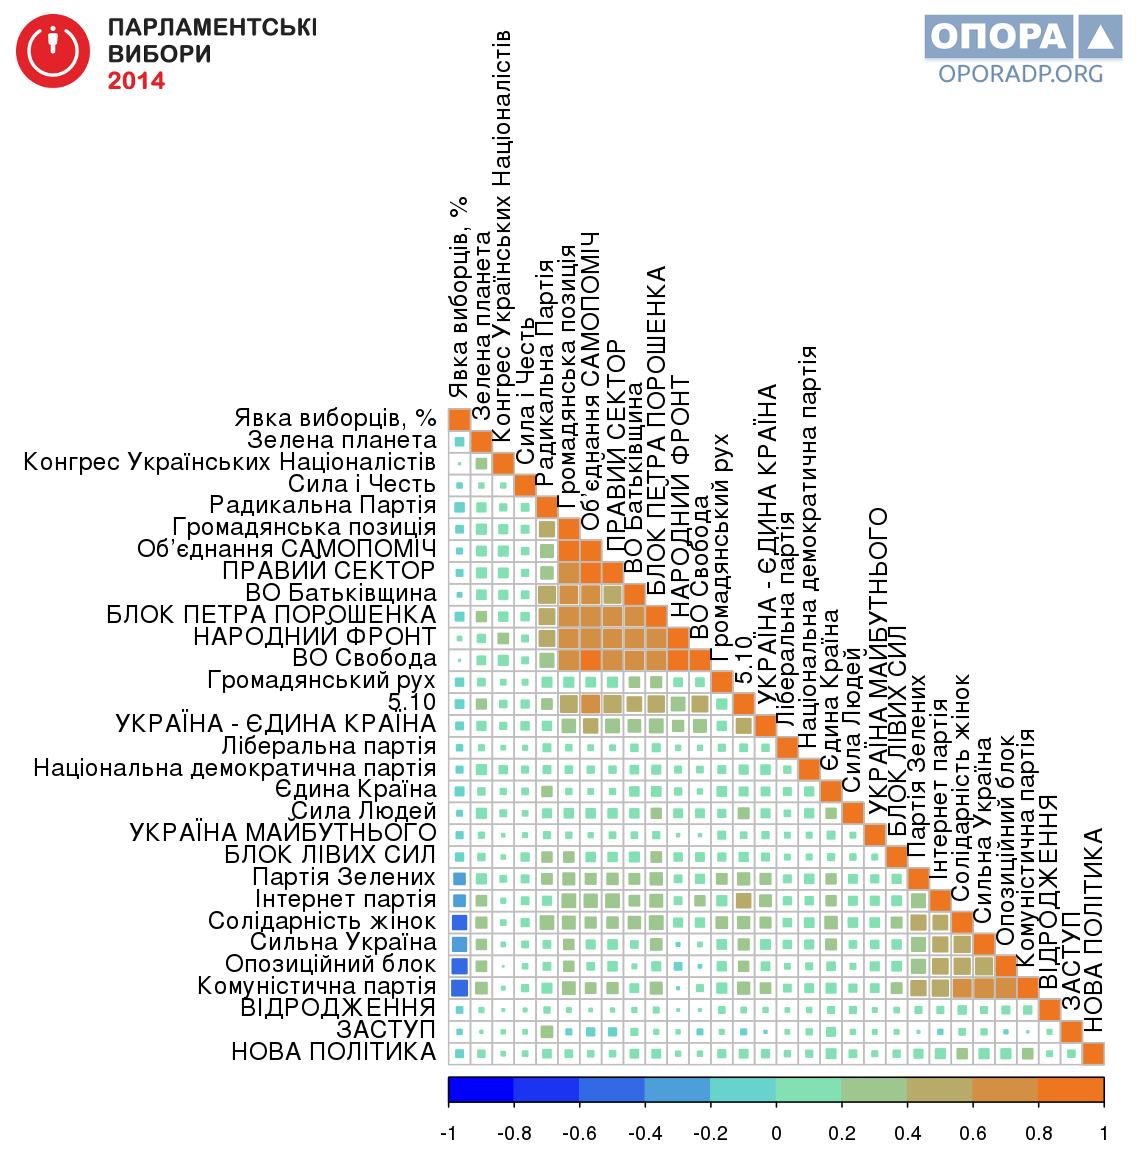
Diagram 1 — Correlation between the quantity of votes given for parties
We didn't place parties in alphabetical order in the diagram. We used the hierarchical clustering to sort out the parties. Thus, parties with high correlation coefficient are placed next to each other on the diagram.
In fact, there are two party clusters: parties representing the "new government" and "old government". There's high correlation between quantities of votes given for these parties. As long as we took the data for every polling station separately, we can state that both clusters had suffered from the competition between them. Thus, there's good correlation between support level of the People's Front and the AUU Svoboda. While the level of support was rising for one party, it was also rising for the other. However, as we all know, division of votes between two competitors is the straight way to the defeat. However, it's not that crucial if people vote in the nationwide district, in contrast to single-member districts.
We should pay special attention to the strong and negative correlation between the number of votes and the voter turnout. It concerns the following parties: the Party of Greens of Ukraine, the Internet Party, the Solidarity of Women of Ukraine, the Opposition Block, and the Communist Party. These parties were given odds as a result of low voter turnout. As we already know from many other researches, elderly people come to polling stations first. This problem is topical not only in Ukraine, but also in many countries of Eastern Europe. Low electoral activeness of the youth allows post-communistic parties not to sink. Activists of the Hide Your Granny's Passport! youth movement in Poland was fighting against this very problem.